10 Years of Earth Challenge
With all the hype since the beginning of 2019 around the #10yearchallenge, I gave an optional assignment to my students in the Data Science in Environmental Earth Systems Science (EESS) course (ES7023) at Nanyang Technological University, to conduct a #10YearsOfEarth challenge (learn more about the Asian School of the Environment at NTU). They compiled some wonderful visuals showcasing environmental challenges or successes in the past 10 years. The class itself is about data analysis and modelling in the field of earth and environmental systems sciences, but we also discuss data-visualisation. This assignment didn’t ask for any analysis, but the students demonstrated their skills in storytelling with data. The following are some of these posts!
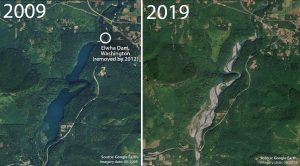
Recovery of River Systems
Image source: Google Earth
Post and collage by: Maricar Robanza (PhD Student)
In 2012, two hydroelectric dams (one is shown here) were torn down to restore critical spawning habitat for endangered salmon species in Elwha. These images show the results in the Elwha River basin of the Washington State Olympic Peninsula. In the 2018 image, the reservoir behind the dam is gone, the exposed silt deposits are gradually diminishing, and natural river flow is returning. (The imagery date for the 2019 picture is not 2019 but actually end of 2018.. but you get the point.)

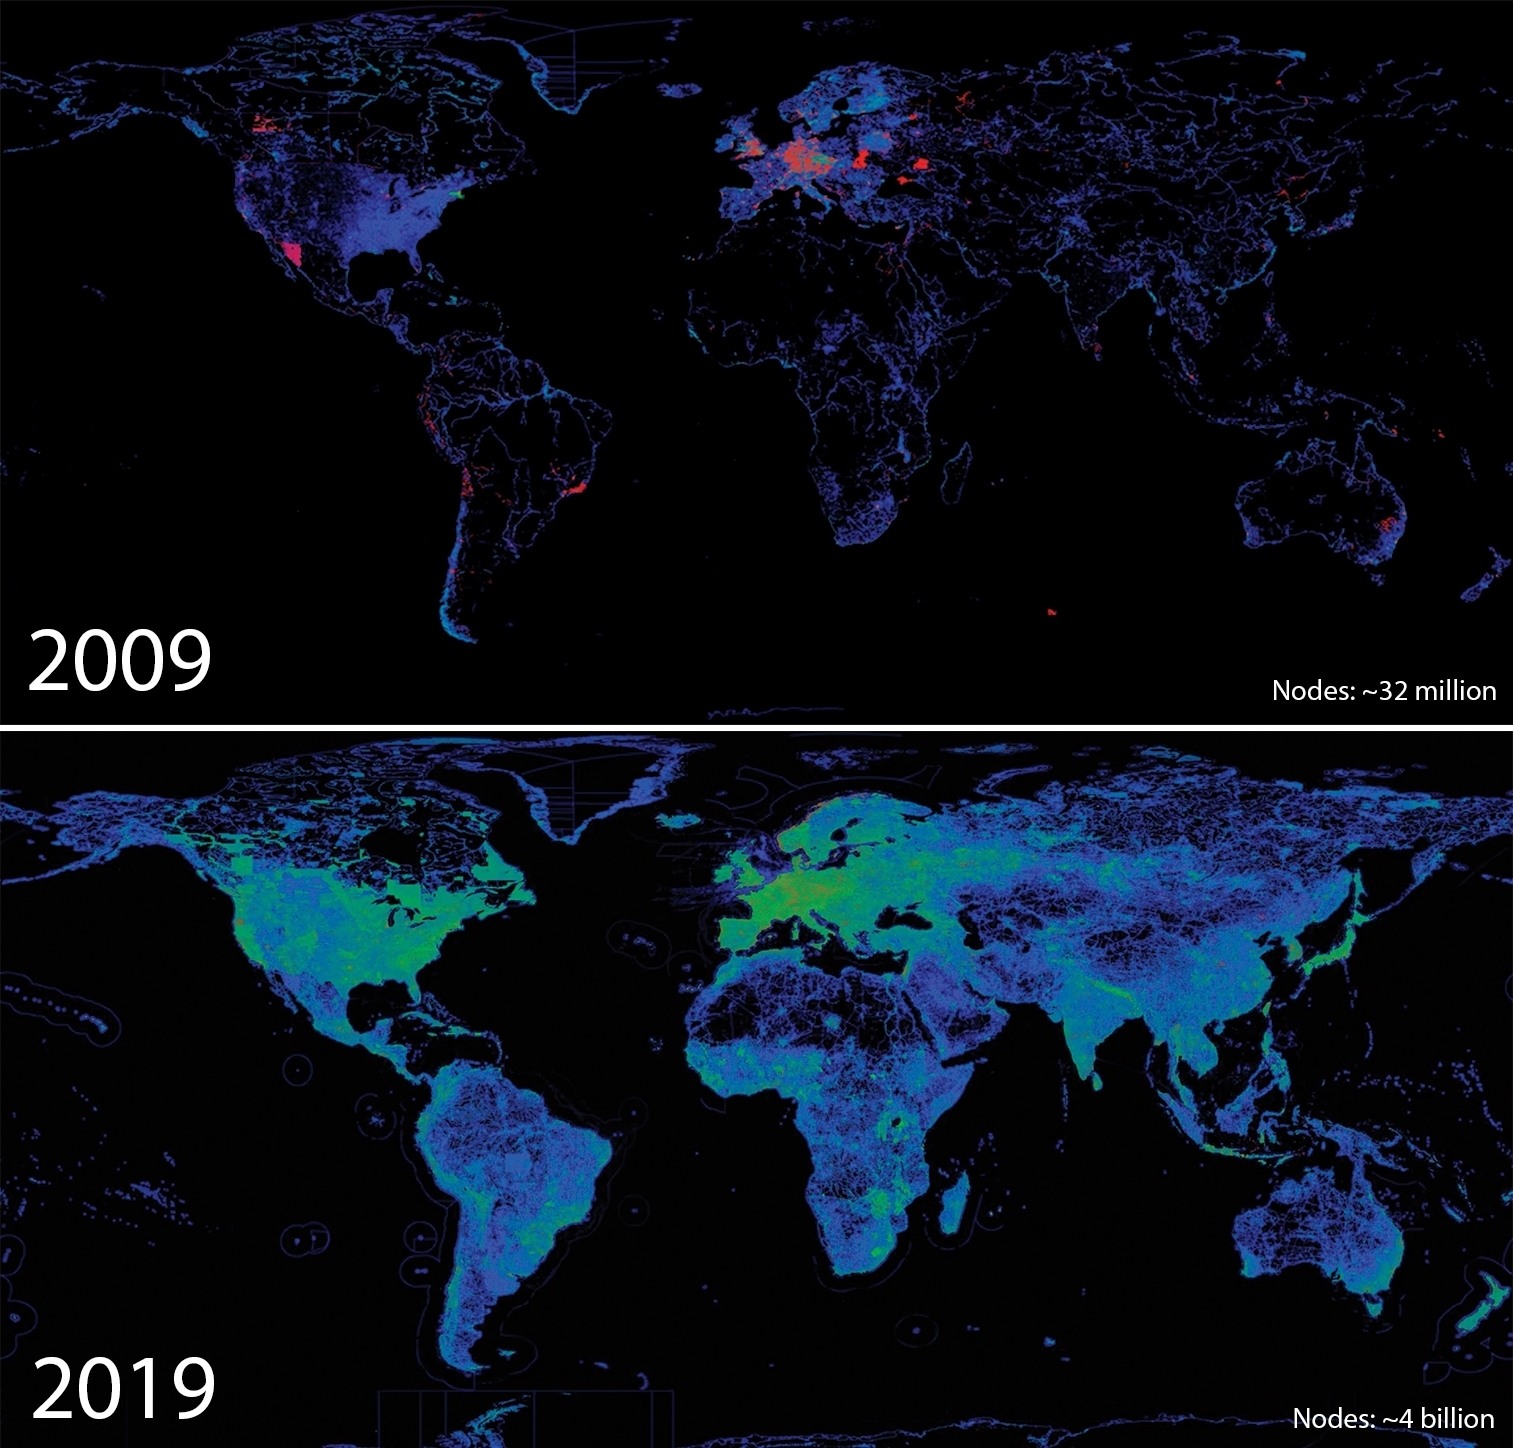
The Growth of Data: OSM Nodes
Image source: OpenStreetMaps
Post and collage by: Maricar Robanza (PhD Student)
These are visualisations of the node density of OpenStreetMap (OSM) data of the world taken from 2009 to end of 2018. Brighter pixels represent areas with higher node counts (more building and road data).
The increase of data demonstrated here is important because such free geospatial data can enable disaster responders to reach those in need. Through projects like #MissingMaps, the Humanitarian OpenStreetMap (HOT) global community creates maps of high vulnerability areas where data is scarce, putting millions of people onto the world map in OSM.
More about HOT:https://www.hotosm.org/what-we-do
Data/photo sources:
Planet extracts: https://labs.mapbox.com/ten-years-openstreetmap/
OSM time-lapse video 2006-2018: https://www.reddit.com/r/openstreetmap/comments/86c9zp/openstreetmap_nodes_history_2006_january_2018/
Beautiful interactive map by Mapbox showing 10 yrs of OSM data:
https://labs.mapbox.com/ten-years-openstreetmap/#0.000000/20.961440/2
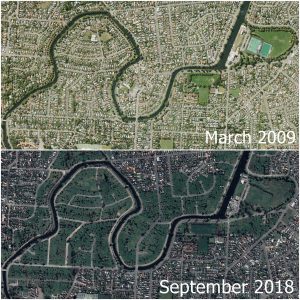
The Christchurch Earthquake: An Anecdote
Image source: Google Earth
Post and collage by: Constance Chua (PhD Student)
These are two GoogleEarth images of Christchurch, New Zealand from March 2009 and September 2018. A number of suburbs along the Avon River were affected by the 2011 earthquake, especially by liquefaction. Over here, we can see that the suburbs of Avonside and Wainoni “the residential red zones”, which were once occupied by houses prior to 2011, are now grassy and devoid of many of the buildings that used to be there. I remember having my first Geology fieldtrip to Porrit Park which is the big park at the top right-hand corner, and looking at all the devastation that were left behind by the earthquake and sand boils everywhere.
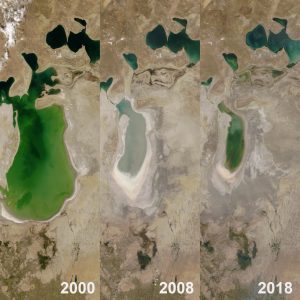
The Aral Sea Crisis Image source: https://earthobservatory.nasa.gov/world-of-change/AralSea Post and collage by: Ross Ong (Research Assistant)
These series of images show what’s left of what used to be the 4th largest lake in the world, the Aral Sea – an example of how humans adversely impact the environment. These were taken from Moderate Resolution Imaging Spectroradiometer (MODIS) on NASA’s Terra satellite. The Aral Sea crisis caught my attention a few years back while reading an article in a Nat Geo magazine. Sadly, it seems the southern (larger) part is beyond recovery. In a last-ditch effort to save some of the lake, Kazakhstan built a dam to separate and isolate the northern part of the Aral Sea. It seems, however, that this crisis has reached the point of no return. Only time can tell whether this lake can go back to the way it was more than 50 years ago.
Read more about it here! https://earthobservatory.nasa.gov/world-of-change/AralSea
You can also check out other environmental changes through time, such as coastline changes, global temperatures changes and changes on the Larsen-B ice shelf at NASA’s website.
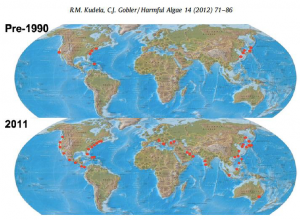
Algal Blooms: A Global Problem Image: M.Kudela, R., & J.Gobler, C. (2011). Harmful dinoflagellate blooms caused by Cochlodinium sp.: Global expansion and ecological strategies facilitating bloom formation. Harmful Algae, 71-86. Post and collage by: Christaline George (PhD Student)
The global phenomenon of harmful algal blooms, which is the core of my research here at ASE, has drastically increased in frequency and intensity over the past decades mainly due to the increasing utilization of coastal waters for aquaculture, increase in global temperatures, other anthropogenic activities that increase the nutrient load into the water systems and many other factors that encourages the unbalanced growth of algae bringing about a disruption in the ecosystem.
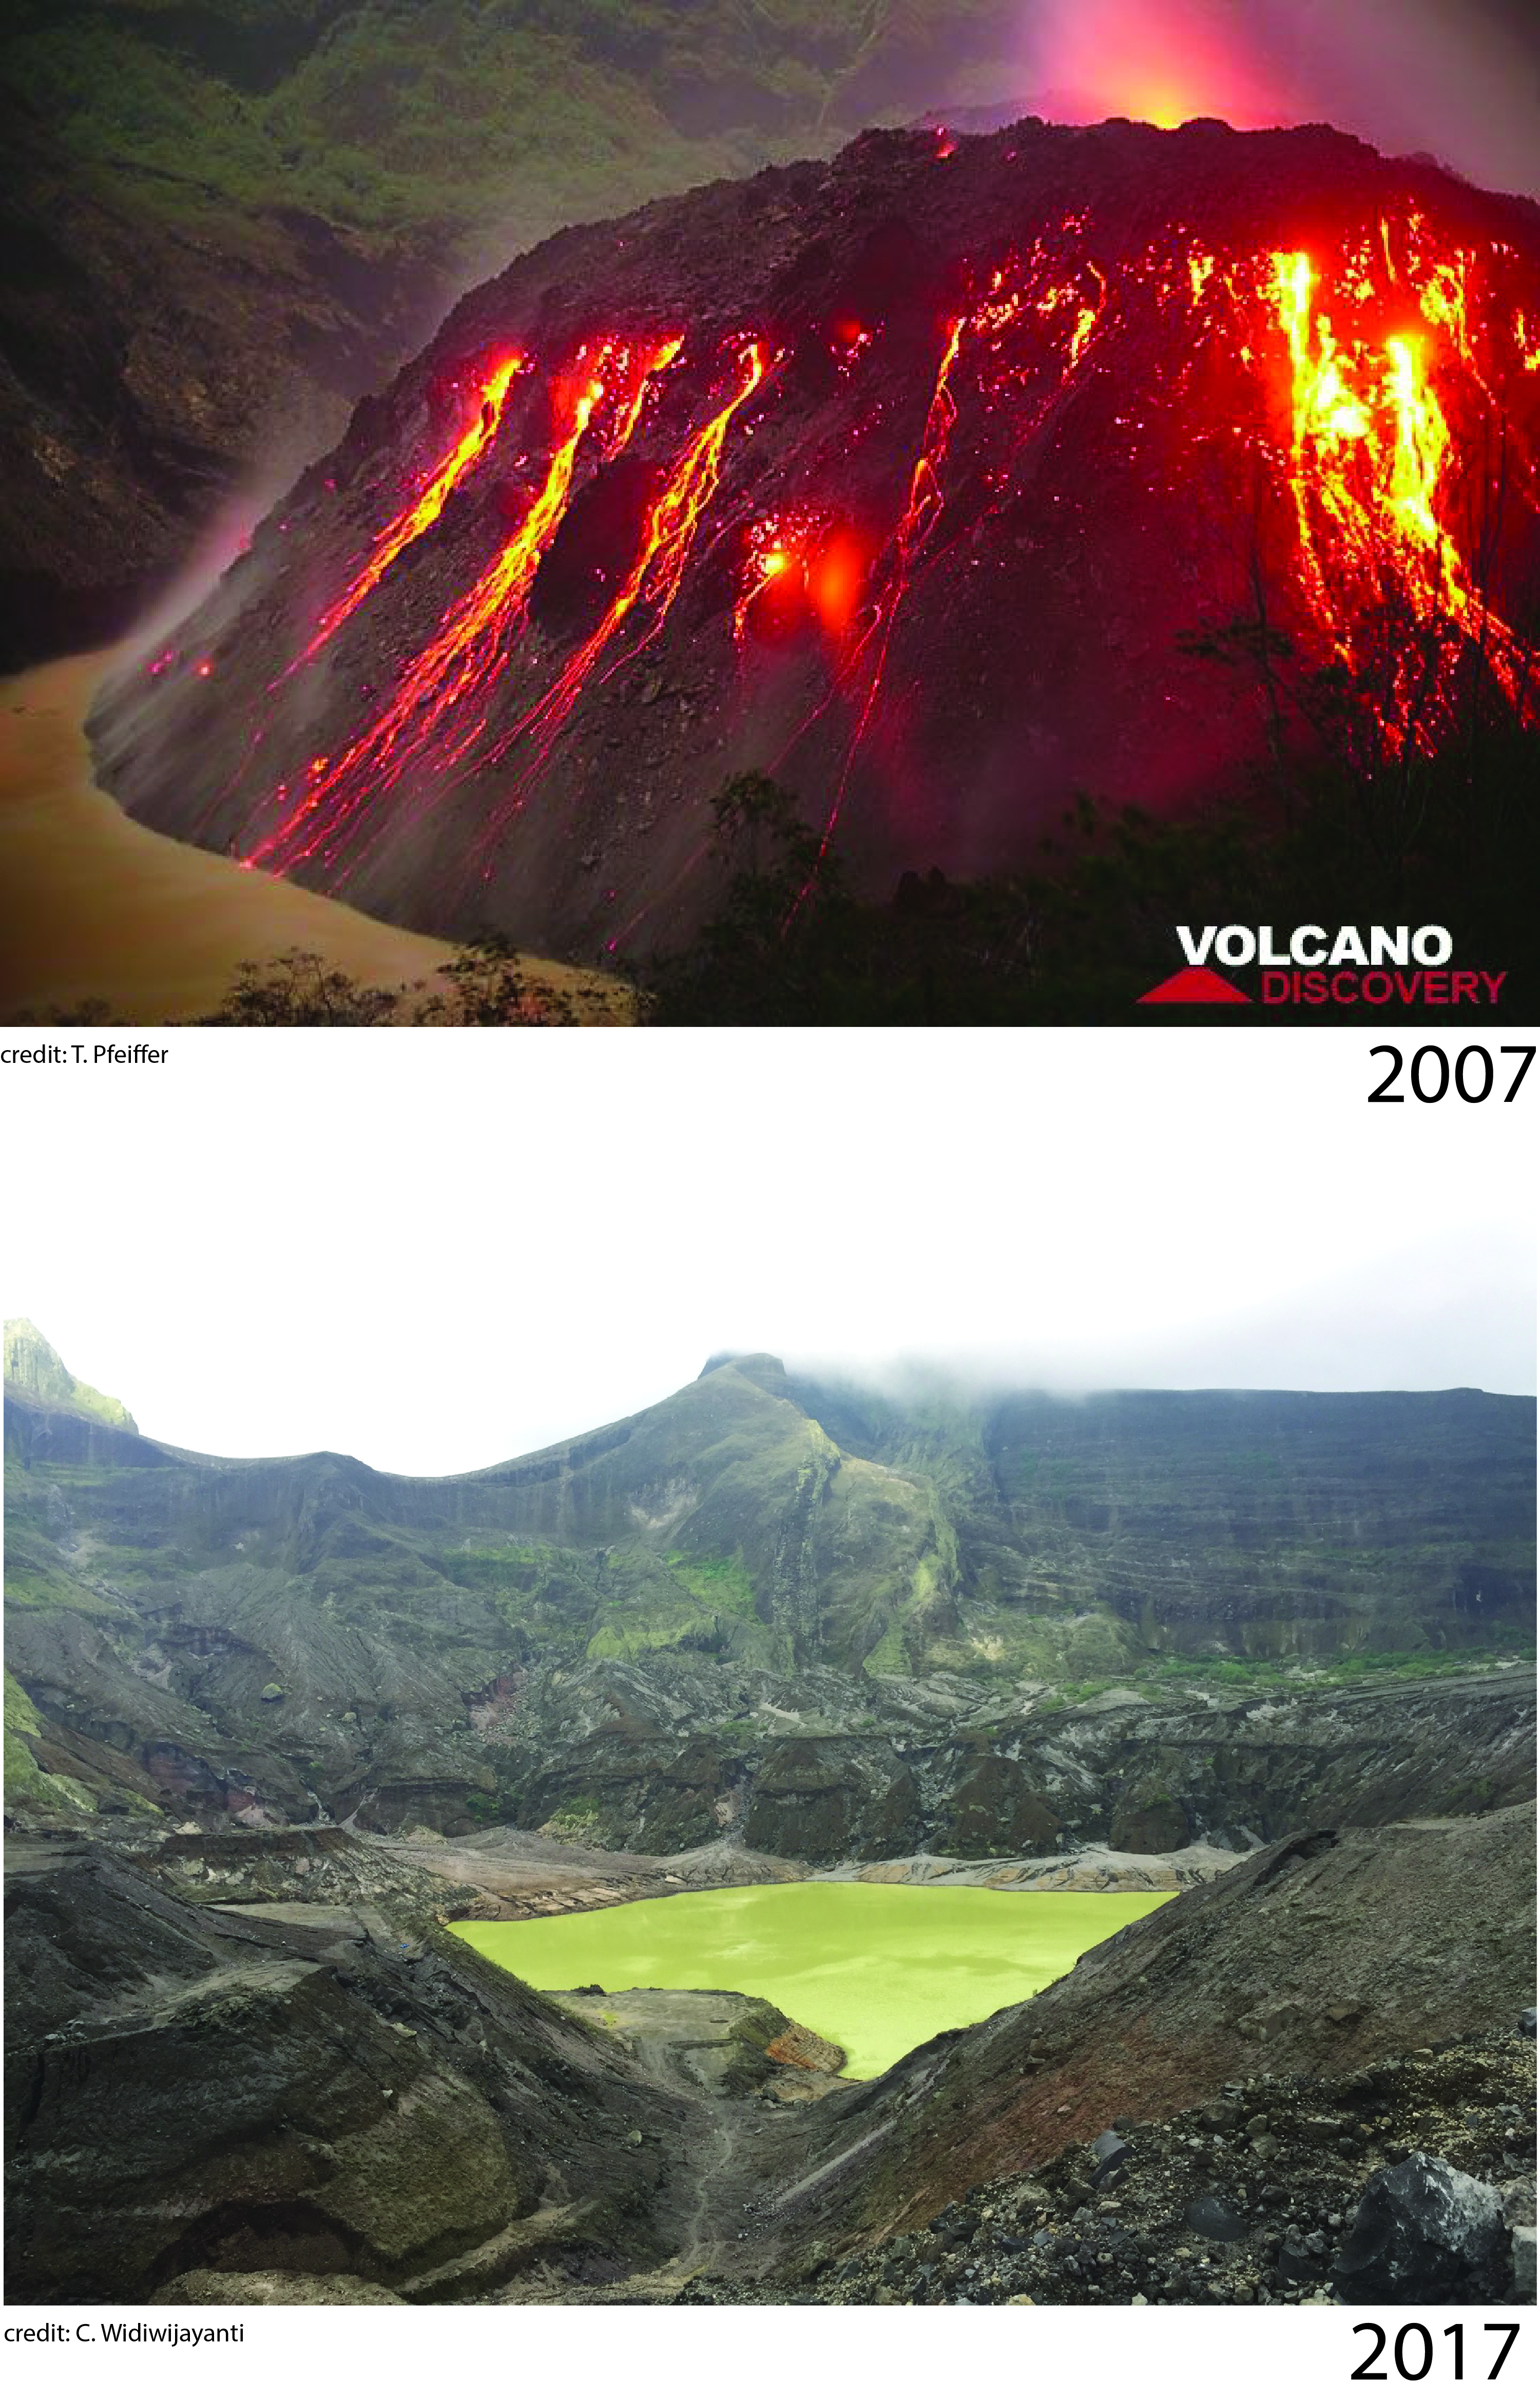
Changes Within 10 Years: Kelud Volcano Image: https://www.volcanodiscovery.com/kelud.html (top); taken by Dr. Christina Widiwijayanti (bottom) Post and collage by: Sri Budhi Utami (PhD Student)
In November 2007, Kelud volcano initiated a year-long unrest period typified by heightened seismicity, outgassing and rising lake temperature. Volcanologists noted the unusual unrest pattern, as Kelud tended to erupt explosively with little warning. Yet instead of erupting explosively, a lava dome 120m high extruded (top picture). Since 2007, Kelud did erupt explosively in 2014. The VEI 4 eruption caused widespread damage and impacted the regional airspace. The chaos from the 2014 eruption contrasted with the quiescent volcanic activity observed in October 2017 (bottom picture) where the only activities of note are the lake bubbling and fumaroles passively degassing.
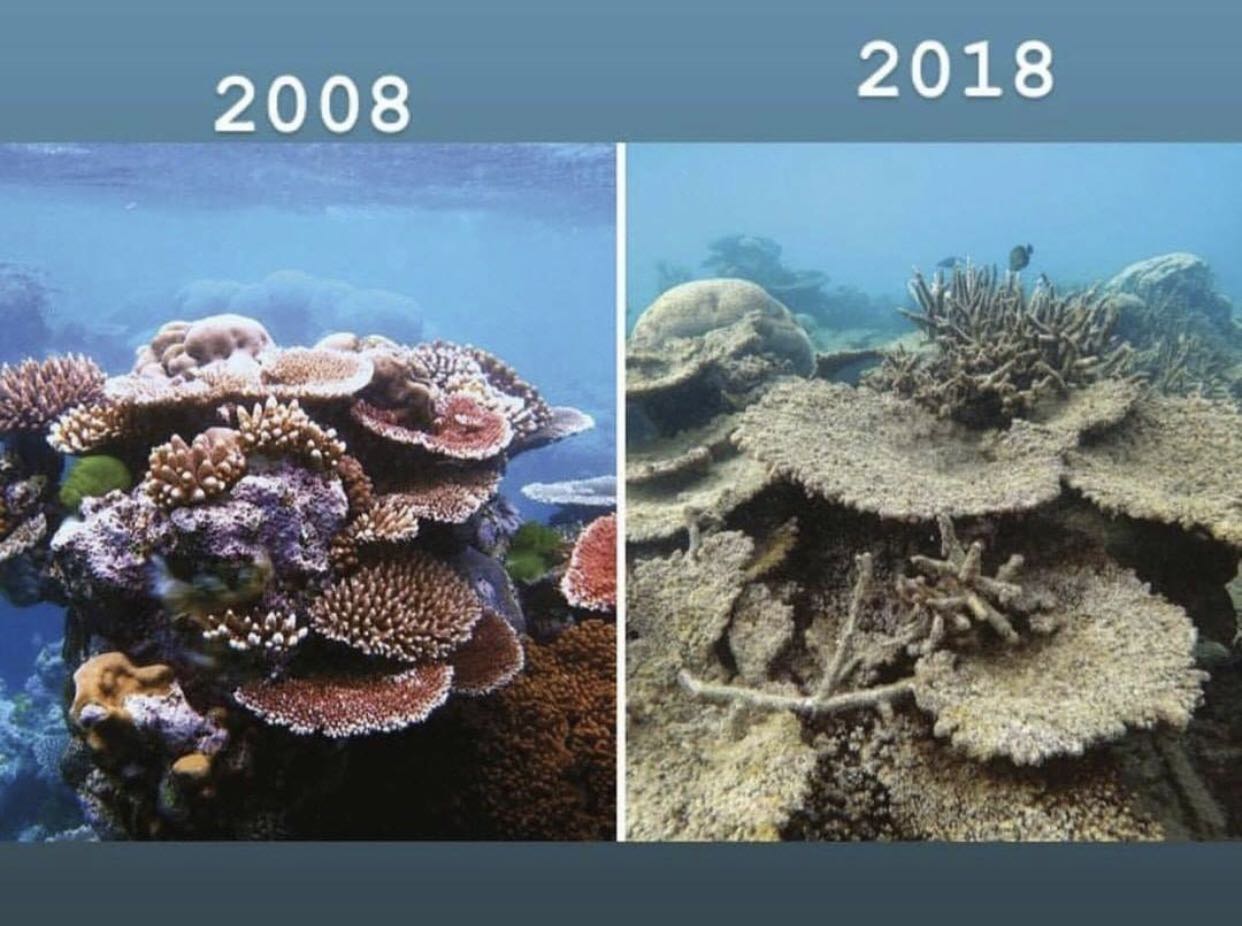
Coral Bleaching
Image source: Instagram
Post by: Pak Hui Ying (Research Assistant)
This is the #10yrsofearthchallenge we should be lamenting about :sob:, especially for those who enjoy diving!
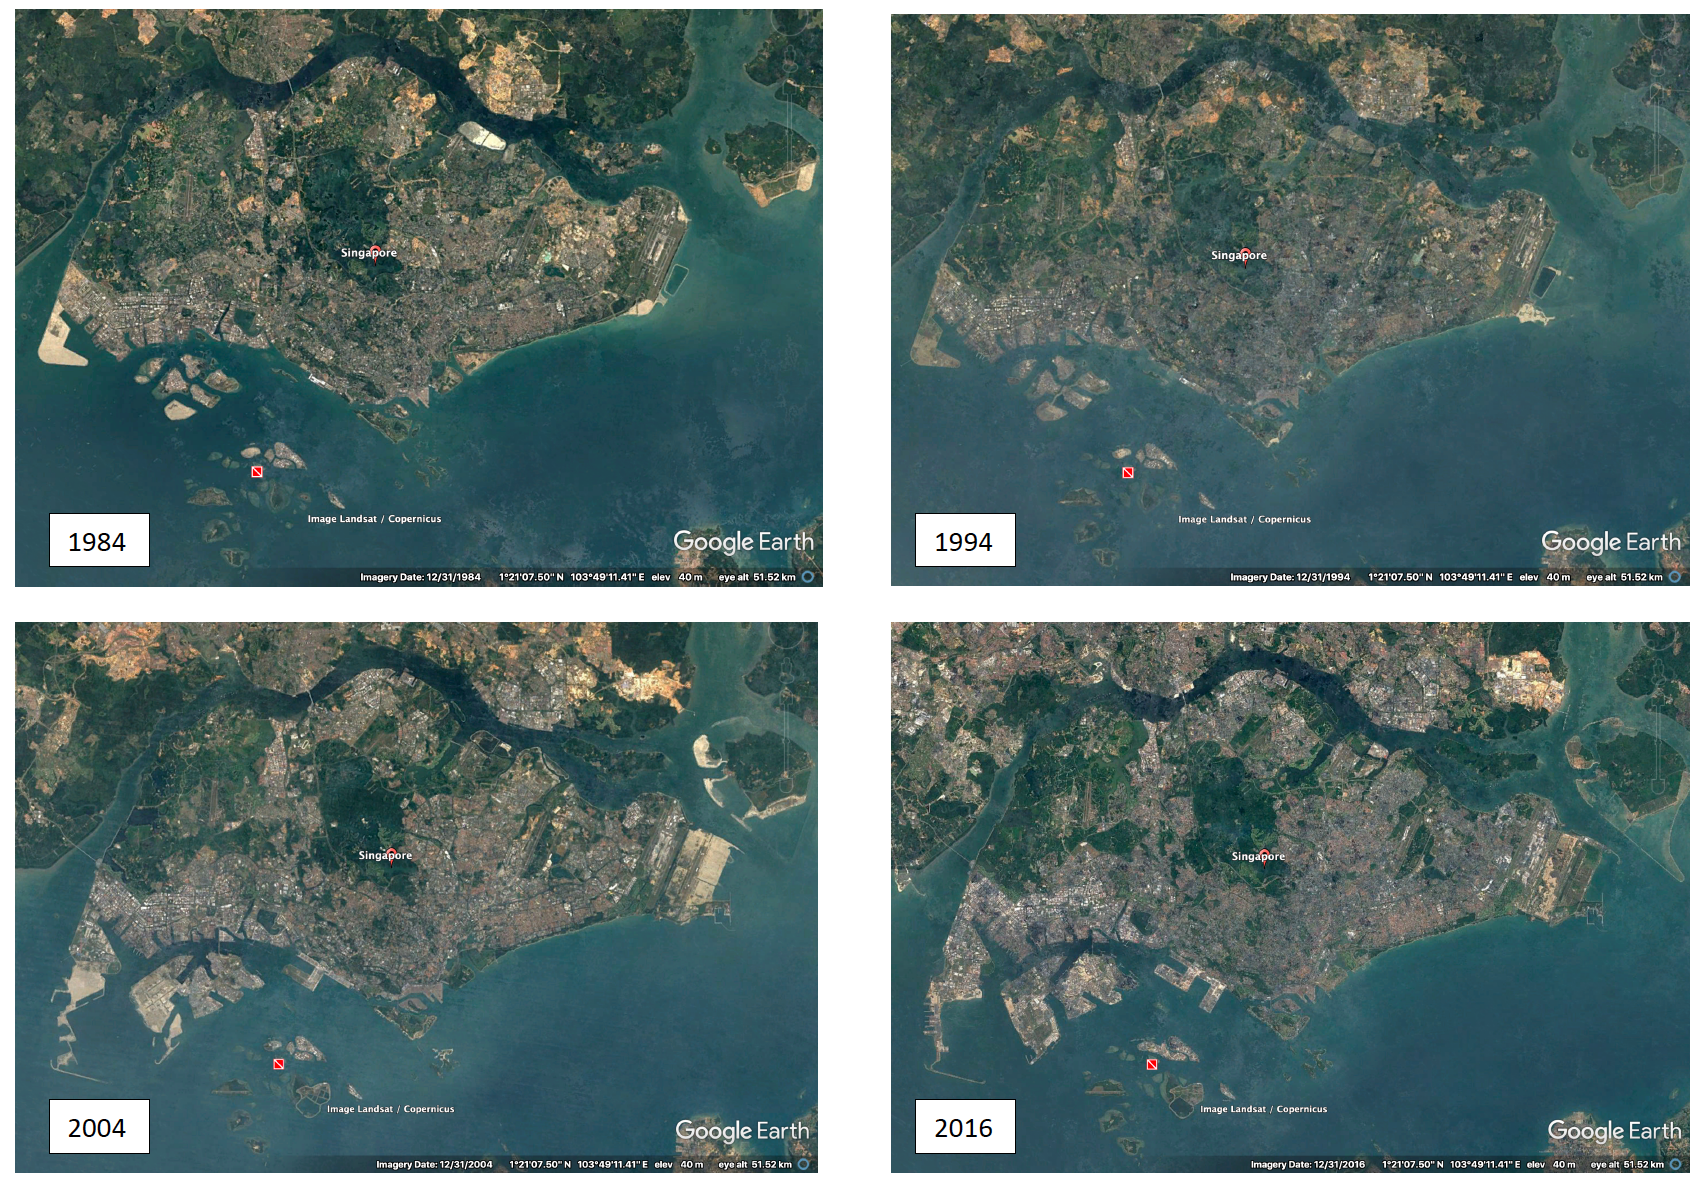
200 Years of Change: Singapore
Image source: Google Earth
Post by: Yan Yu Ting (PhD Student)
A bit late to the game but here’s an illustration of how Singapore’s coastline has changed over the years. Over 2 centuries, Singapore’s land area has seen a 25% increase from 578 to 719km2. While we enjoy the increase in land area, we must not forget how the biodiversity and ecosystem has been impacted due to human activities. With reference to the Tengah “forest town” issue, how should Singapore continue to develop without compromising the vulnerable ecosystems and wildlife that we have?
Students also shared posts put together by others:
Retreating Glaciers Post by: Gizem Mestav Sarica (PhD student)
Before/after comparison photos of Rhone glacier (Valais, Swiss Alps), the use of the slide tool to compare the panorama photos from past and today is cool: You can also select different dates.
9 Years of Change: Kilauea Crater By: Olivier Bernard (PhD student)
The morphology change of Kilauea crater over the last 9 years: 2009-2018 (most of the change happened during the historical eruption of Leilani last year), shown with those 2 DEM: https://opentopography.org/news/2018-kilauea-volcano-datasets-available-download
Crop Circles in Saudi Arabian Desert By: Olivier Bernard (PhD student)
How far will humanity go ? Crop circles in Saudia Arabian desert?https://earthobservatory.nasa.gov/images/77900/crop-circles-in-the-desert
Some Compilation of the 10 Year Challenge By: Miranda Ong (Undergraduate)
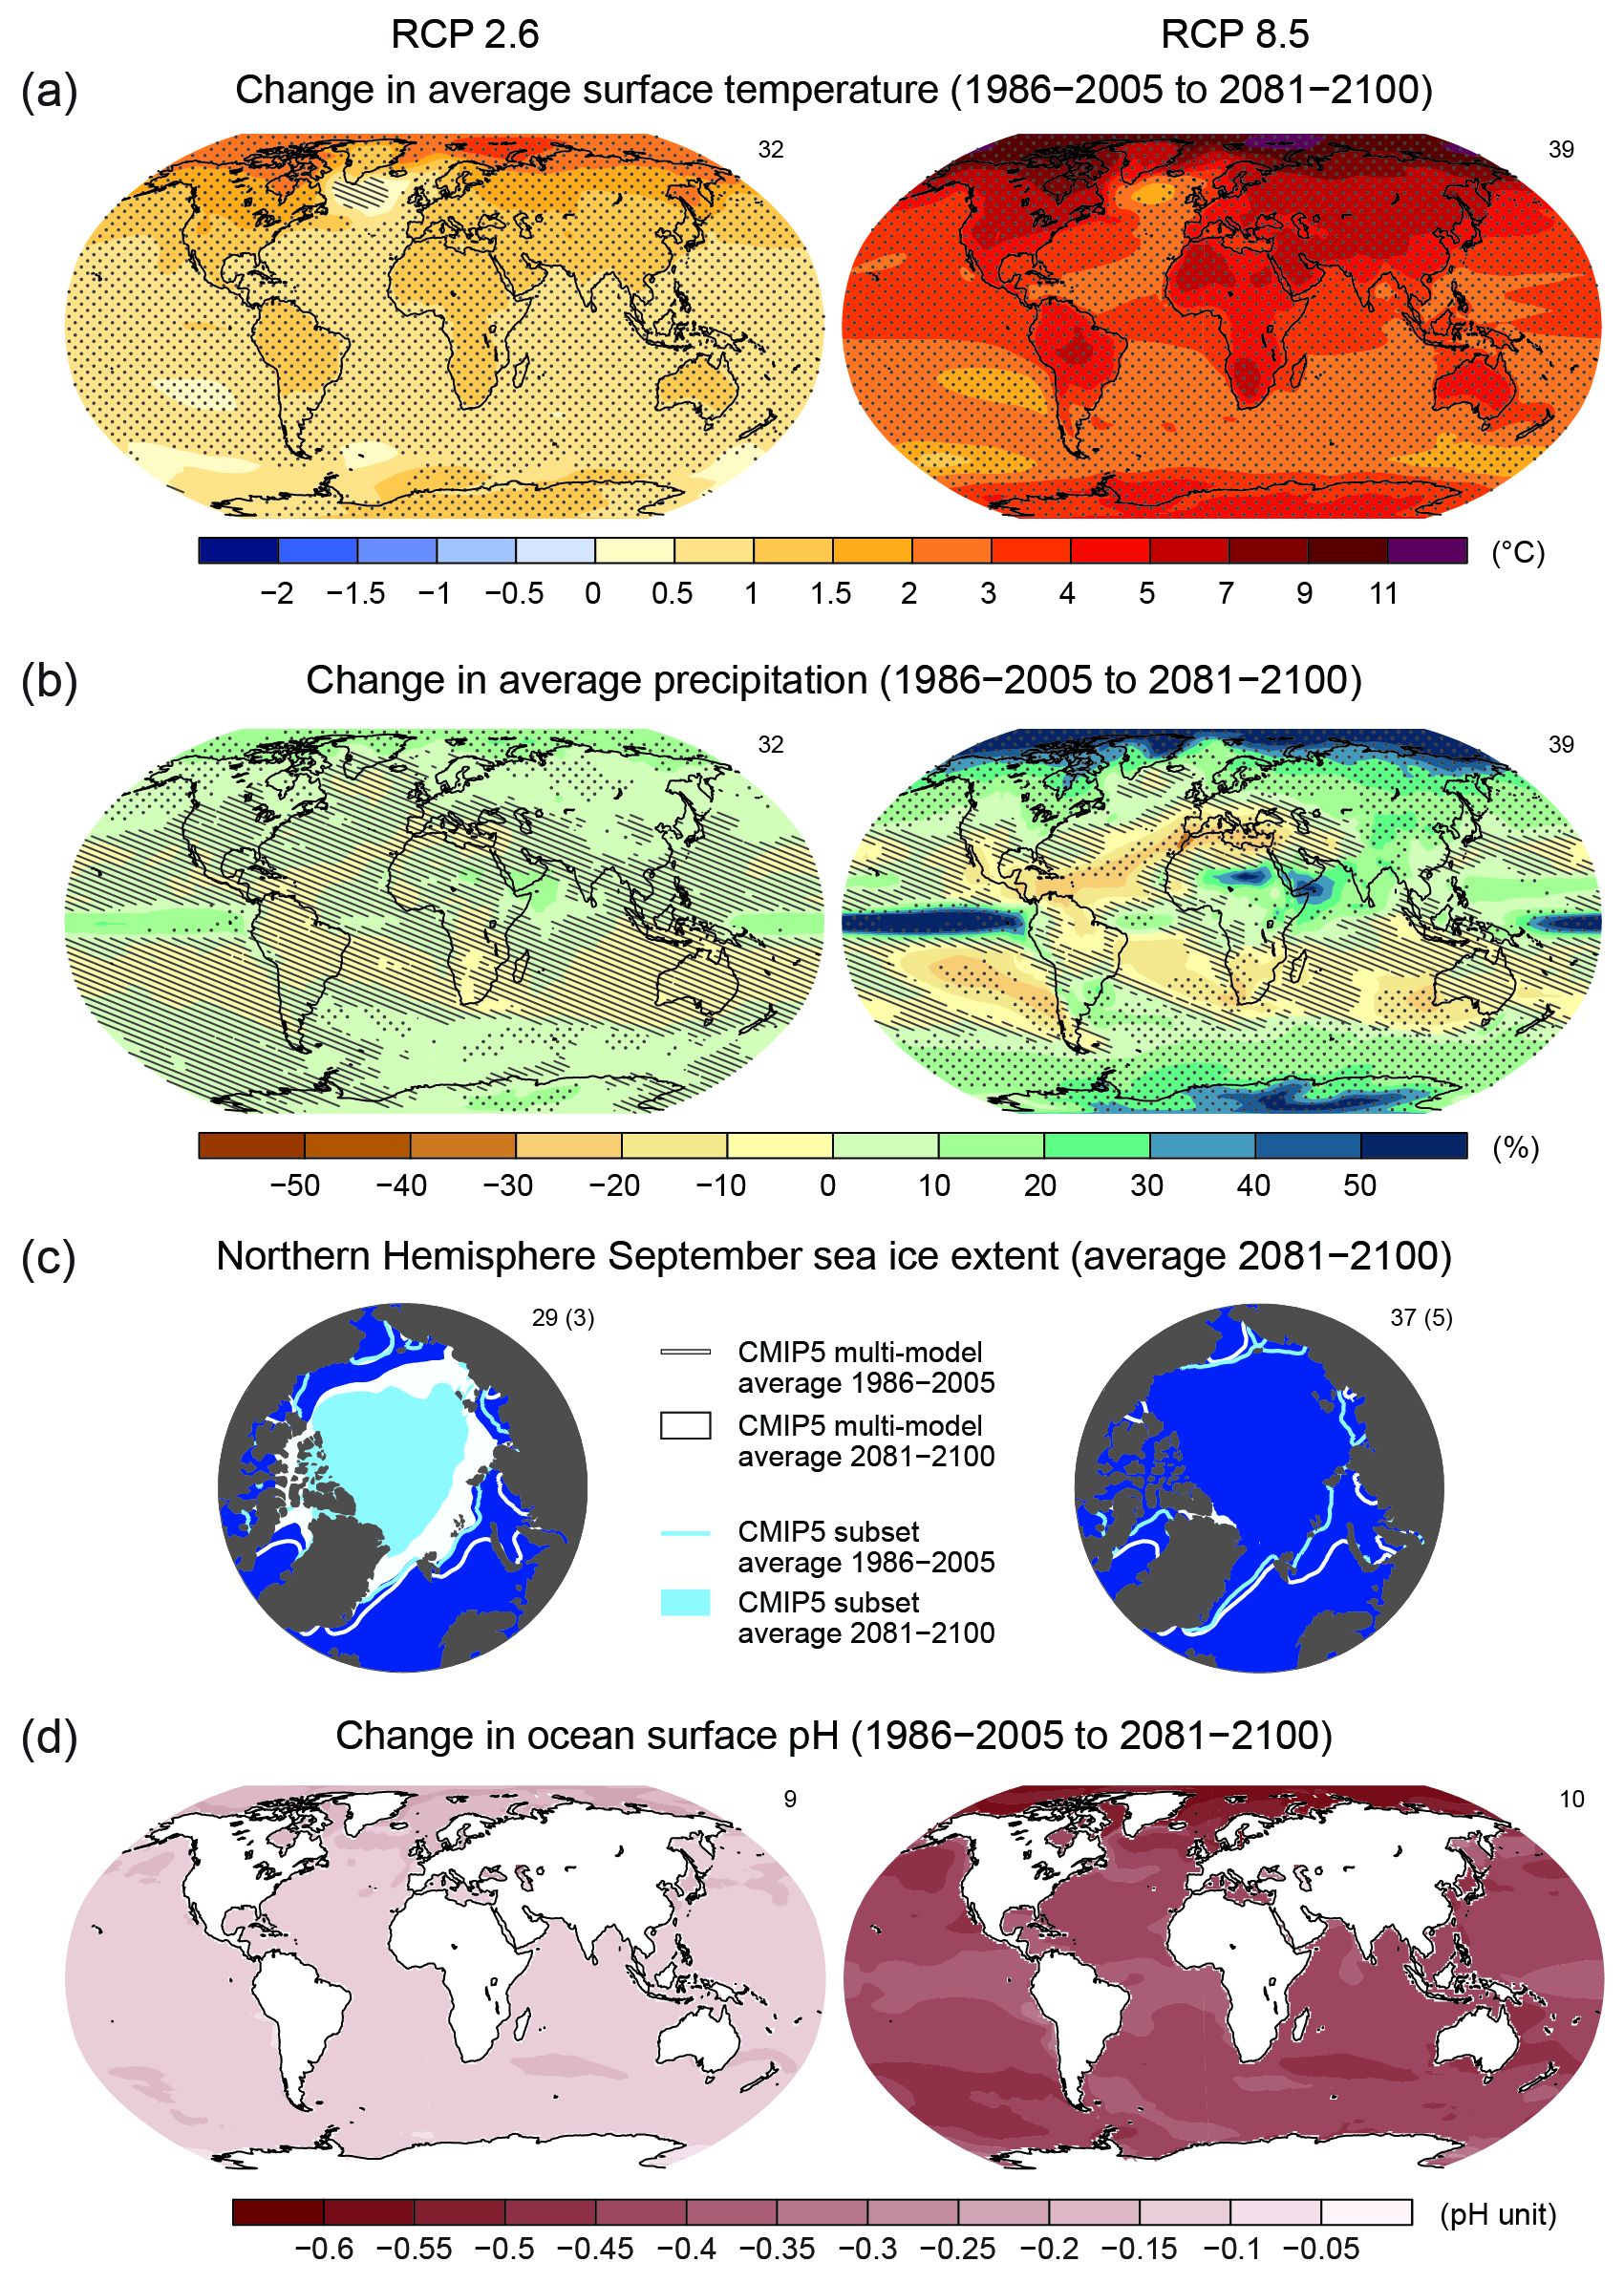
Changes in a 100 Years – The Past & Our Possible Futures By: Christaline George (PhD Student)
The IPCC reports changes over a 20 year period and uses that data to make projections for the future, also for a 20 year period with regards to surface temperatures, precipitation, ocean surface pH and the sea ice extent in the Northern hemisphere. http://www.climatechange2013.org/images/figures/WGI_AR5_FigSPM-8.jpg
Destruction of Heritage: Deforestation By: Anushka Rege (PhD Student)
Large-scale deforestation ends within minutes a natural system that provided us with so much for decades! https://www.instagram.com/p/Bsv1BNchKo7/?utm_source=ig_embed
R! By: Muhammad Irfansyah Lubis (PhD Student)
The number of R packages ever published in CRAN which goes over 10,000 since 1998 (#20yearschallenge). So how do you find the ones you need?? Try this link
https://blog.revolutionanalytics.com/2017/01/cran-10000.html
The Tree of Life By: Daniel Vaulot (Visiting Professor)
This post was written by David Lallemant and Lim Tian Ning.