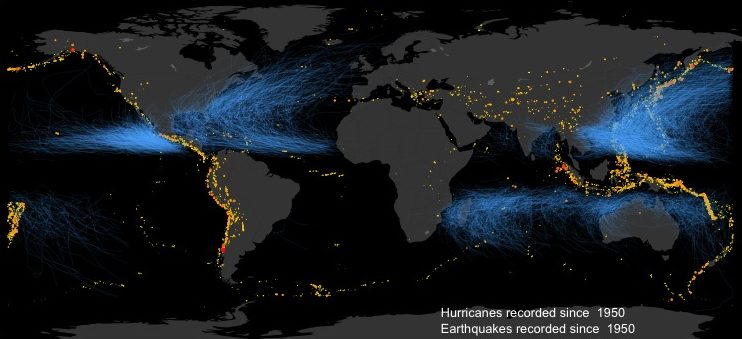
Mapping Global Earthquakes and Hurricane tracks with R
I created this code in order to do a visualization of natural hazards globally, to use as a graphic for a new initiative at Stanford on “urban resilience.” You can check out the group here: http://urbanresilience.stanford.edu/ It is quite simple, and demonstrates some of the neat data visualizations possible with R. I’ve only included earthquakes…
Read more